.svg "SpotDevLogoOrange (2)")
Having worked on a number of campaigns, I'm always asked by business owners and marketing managers (and rightly so) how much of an increase will they see in sales if they invest budget into a marketing campaign?
While ROI is a valid metric to observe, to ascertain the impact of your campaign there are many other metrics marketers should keep an eye on that indicate how a campaign is performing and where improvements can be made. In addition, a lot of time and resources go into campaigns, so it’s only right you track your work.
Abundance of tools
One of the issues marketers face is that there is an abundance of reporting tools and marketing software available, and it is extremely easy to get sidetracked and overwhelmed. Here’s an image that portrays the wealth of tools at our disposal: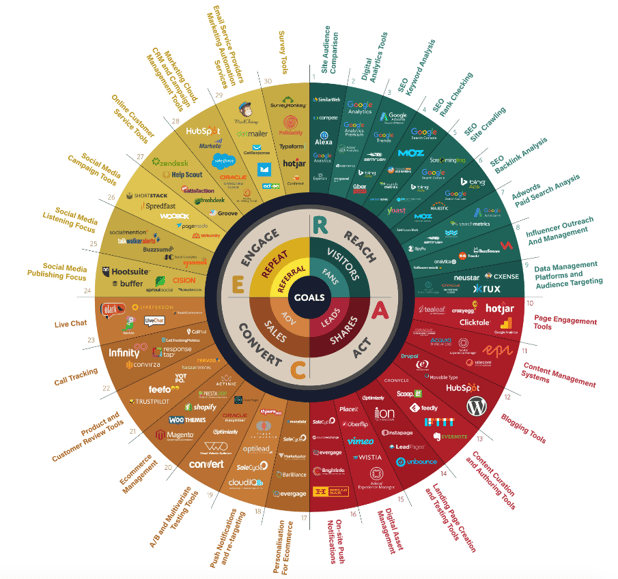
So, for the sake of maintaining sanity and an efficient manner of working, it becomes necessary to choose a few reliable and trustworthy tools to report from. For example, while keeping a close eye on the key performance indicators I want to be able to track regularly, my go-to tools are:
- Google Analytics - provides me with a wealth of metrics, such as number of sessions (users) a website, blog post or landing page has generated, what the bounce rates are etc.
- Google AdWords - the reporting functionality allows me to discover the type of keywords that are driving conversions on my paid ads, geographic location of where the conversions are being made and more.
- HubSpot - the reporting tool within HubSpot allows me to delve into how each traffic source, such as organic, paid or social, is performing in terms of website traffic, visitor to lead conversion, lead to customer conversions. HubSpot also allows me to gain insights in how my marketing efforts are affecting the sales targets through its deals board and CRM.
- Hotjar - primarily focused on user engagement on web pages, this tool provides insight into how people are behaving once on the website, how far down they are scrolling and where they’re clicking. With options to record sessions, you can really get a good understanding of how users are interacting with your key website pages, allowing you to make impactful changes going forward to improve conversion rates.
Due to their comprehensiveness, these four tools provide me with an ample amount of data, which in turn provides me with a good understanding of how my inbound marketing tactics are performing.
Lets draw back to the main topic of my blog — what metrics should you use to gauge the success of your digital marketing strategy? Answer — it all depends on the goal of your campaigns!
Taking a fictional company as an example, let’s call them Tim’s Travels, I will outline areas I would look to measure and improve upon to help Tim's Travel's overall business goal of driving more leads through their websites and ultimately selling more holidays!
Landing pages
Landing pages should be used to filter traffic to a particular content offering, such as a brochure or educational guide, to capture a visitor's information, turning them into a lead that can then be nurtured through their buyer's journey to become a customer. By creating a focused landing page to drive traffic to, you will be creating a clear user journey for your visitor and compel them to leave their details with you in return for a valuable piece of content.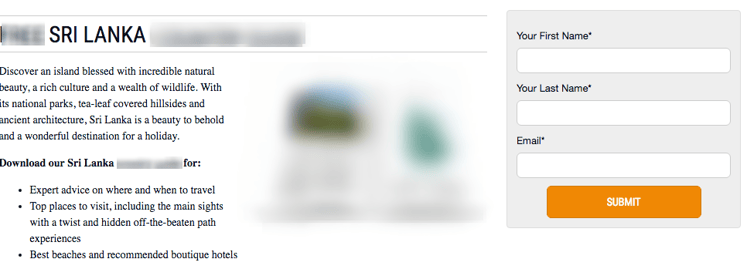
Key Metric: Sessions and Conversion Rates
When it comes to a landing page, the most important metrics to analyse will be sessions (how much traffic is landing on this page) and conversion rates (how many people filled out the form and converted on this landing page).
If your landing pages are not getting very high numbers of sessions, you will be able to see that you will need to improve the visibility of the landing page. This might be by making sure you have strong and clear call-to-actions driving users to the website in relevant areas of the website, improving the SEO of the landing page or pushing it through paid media or social channels.
However if you have a good level of traffic getting to the landing page, but no one is filling out your form, then you need to look at your conversion rates and look for ways to improve these, such as:
- A/B testing call-to-action buttons;
- where the form appears on the page; or
- what images you are using.
By making small changes you'll be able to see what works and what doesn't, and then apply any learnings you've made on this landing page across others on the website to improve the overall conversion rate of your website.
Tools such as HotJar allow you to create heatmaps and recordings, providing you with insights on how people are interacting with your landing pages, for example scroll depth and click maps.
Emails
Email is a great way to keep contacts engaged with your brand while you nurture them from leads to customers or repeat customers! But what metrics should you be reporting on to find out how your email marketing is supporting your overall marketing strategy?
Key Metrics: Open & Click-Through Rates on Devices
A top-level view of how emails have performed would be to look into the overall open and click-through rates, but you will also want to dig deeper than that.
By looking at how the emails have performed on individual devices, you can then decide if design tweaks are needed to improve the performance of your emails by how they appear on your dominant devices. 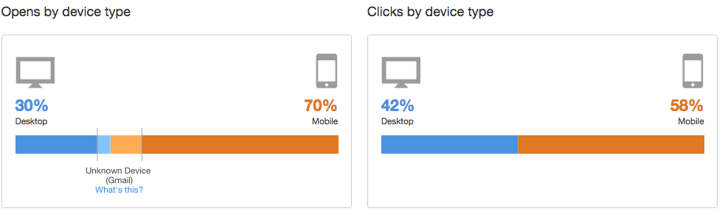
As can be seen from the image, Tim’s Travels emails perform better on mobiles, and so they will know that they need to make sure that their emails are mobile-friendly and any call-to-action buttons are large enough to be pressed on a mobile device.
By monitoring your open and click-through rates you will also be able test different areas of your emails. Such as if your open rate is low, you might want to try changing the language used in your subject line. However, if your open rate is good but no one is clicking through to your website, you will know that changes to the body of the email or where your call-to-actions are placed may need tweaking.
Social media
Using HubSpot, Tim’s Travel's published posts on various social media channels, including Facebook, Twitter and Google+.
When using social media as part of your digital marketing strategy, it is important to have a well-rounded content strategy, sharing educational or engaging content alongside brand and product news to keep users engaged with your social channels.
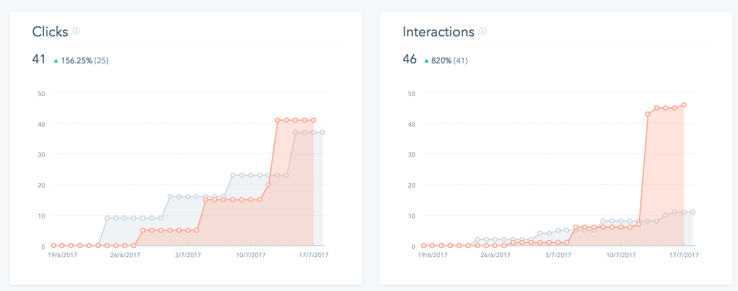
Key Metrics: Clicks and Interaction
For Tim’s Travel, the most important metrics are:- Clicks
- Interactions (this includes Facebook Likes, Twitter retweets, +1’s on Google+ etc.)
These metrics allow you to see overall interaction rates to identify if the content you are promoting is engaging enough for users to click-through to your website. If you're seeing low clicks and interactions across any social media channel, you might want to consider your content blend or if you're even posting the right content on the right channels for your target market.
Website Analytics
When looking at your overall website performance, you will want to understand, how people are finding your website, what they are doing once they get there and how long they are staying on your website. You can then go on to analyse what pages are driving the most traffic, where you're losing the most traffic and where people are spending the most time.
Key Metrics: Sessions, Users, Pages Per Sessions, Sources
There is a wealth of data that can be found in tools such as Google Analytics, which can tell you a lot about how well your website is performing. To avoid confusion, here are the ones you must focus on at least.
Sessions — By monitoring your sessions per month, you'll be able to measure if your website audience is growing and if any additional marketing tactics have affected the level of traffic to your website.
Users — Keeping an eye on the number of users you are getting each month will help you determine if people are coming back to your website regularly and if your overall brand reach is growing or falling.
Pages per session — This will help you pick out how many pages people are visiting on your website in one session. Are they landing on one page and dropping off after a few clicks? Or are they moving around your website, engaging with your content and converting into a lead?
Sources — The traffic sources report is a great area to learn more about how your users are finding your website. If you're seeing that the majority of your traffic is coming from organic, you will likely have a really good SEO strategy in place. However, if a lot of your traffic is coming from social then you are able to see that your social media content is working well.
Blogs
Blogging is a vital part of any digital marketing strategy, enabling you to optimise for specific keywords to help with your overall SEO strategy. Blogs will also be your primary resource for educating your target market.
You should have blogs relating to all stages of the buyer's journey, as well as discuss wider topics around your buyer persona's pain points to help drive more traffic to your website and improve your brand awareness.
Key Metrics: Time Spent on Page, Exit Rate, Organic Source Traffic
By monitoring the time spent on the page and exit rates, you'll be able to see how engaged your audience is with the content you are covering in your blog.
If you have a successful blogging strategy, users will be interested enough in the content you are writing about to hold their attention for the length of the blog. If your exit rates are low, you can be sure that users are clicking on the internal links within your blog and exploring more of your website.
Organic source traffic is also important to monitor for your blog reporting, as this will be the key performance indicator that your blogs are well optimised for search engines and is relevant to the search terms that your buyer personas are searching for.
If you start monitoring the above metrics on a monthly basis, you'll soon start to see the bigger picture of how your current marketing strategy is working and what is not yielding results. By understanding your average results for each metric you can use these to help plan your marketing going forward to see where improvements can be made.
Interested in finding out more about some of the marketing tactics mentioned in this blog? Download your free guide to running an inbound marketing campaign below.
Our content includes affiliate links. This means that we may receive a commission if you make a purchase through one of the links on our website. This will be at no cost to you and helps to fund the content creation work on our website.