.svg "SpotDevLogoOrange (2)")
From analysing how users are interacting with your website, through to how people are engaging with you on social media, it’s pretty easy to find yourself down a rabbit hole of numbers, percentages and graphs.

The truth is, a lot of these metrics don’t provide useful insights. At least not without understanding the wider context.
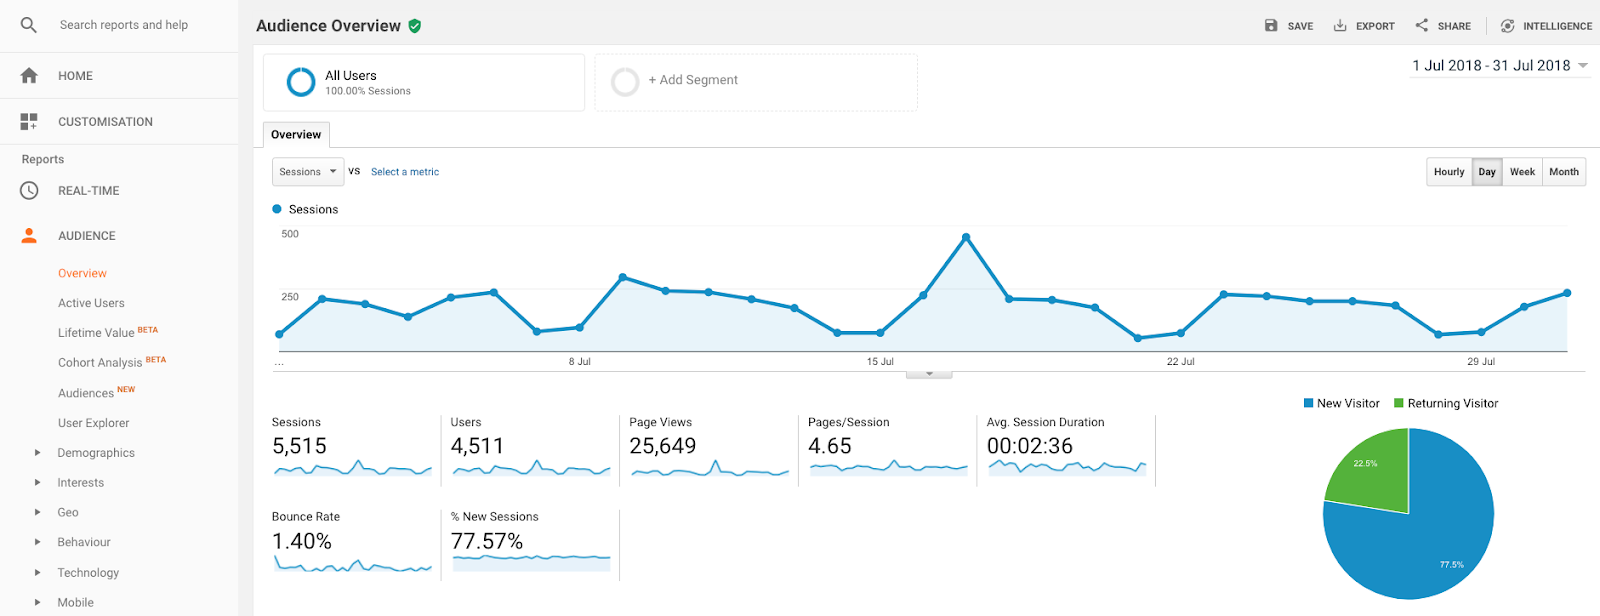
Let’s start with some metrics you’ll find front-and-centre in your Google Analytics dashboard.
Total website users / sessions
You might be saying to yourself, ‘But wait, without a decent number of website visitors how can I hope to sell the number of products or services I need to?’
Here’s the point. You might be getting one million unique users every month, but if they’re the wrong users, it isn’t going to make a positive difference to your bottom line.
A steady increase in Users or Sessions is great, but only if it’s matched with a stable or increasing eCommerce or goal conversion rate.
On the other hand, a spike in traffic that is matched by a drop in conversion rate is a clear indicator you’ve seen an increase in the wrong sort of users.
Users / sessions over a certain period
Equally, you shouldn’t get too hung up on the total number of Users or Sessions your website received in a given time period, for example a calendar month.
A significant drop month-on-month doesn’t necessarily signify anything bad, while a large spike doesn’t necessarily mean anything especially good.
Could industry seasonality be playing a part? Maybe it’s just a one-off anomaly.
Never look at a month-on-month comparison in isolation. Instead consider the broader trend. If traffic has been falling for the last six months then that’s something to be concerned about, not the month-on-month drop.
The caveat to this is that a sudden large drop in traffic could point to a major issue, whether that’s a Google penalty or technical issue that needs to be resolved.
Again, you need to take into account what else is going on with your marketing.
For example, let’s say you ran a social media campaign last month, and in your analytics platform you can see a jump in traffic coming from social. That’s great, but unless they’ve gone on to complete the action you were hoping for, whether that’s buying a product or subscribing to a newsletter, was the campaign successful? I’d suggest it wasn’t.
There are a couple of other metrics you will see prominently displayed in your Google Analytics dashboard that I want to talk about:
Bounce Rate
A quick definition: bounce rate is the percentage of website visitors that only visit a single page within a session. For example, a user visits your homepage but leaves before clicking on any links in your navigation menu.

A lot of marketers will tell you that a high bounce rate is a bad thing. Instinctively this makes sense, right? If a user enters a page and then leaves without checking out the rest of the site, they’re probably not interested.
Again, it’s all about the wider context. Here are a few examples to demonstrate that.
Let’s say a user arrives on your homepage, checks out a few other pages and thinks, ‘Huh, I like the look of what these guys are offering. I’m going to give the a call when I’ve got some time tomorrow.’
Tomorrow comes around but that user didn’t note your phone number, so they jump back onto the homepage and give you a call.
That session is recorded as a bounce, but that session led to a new lead.
The type of service you offer is also a factor.
If you’re an emergency locksmith it would make sense for your website to have a high bounce rate. People are locked out of their house and need a locksmith out ASAP. They don’t have any interest in browsing multiple web pages, they just want to get the phone number and call you.
You could argue that it’s worth monitoring bounce rate on certain pages, for example landing pages where we want them to complete the form and move on to the thank you page.
It’s true that if the user has bounced then they can’t have possibly completed the form, but just because the bounce rate of a particular landing page is 50%, this doesn’t mean the other 50% has completed the desired action — just that they’ve visited another page. Any other page.
In this instance you want to look at landing page conversion rate. If your content management system doesn’t provide one you can work it out yourself by dividing total sessions on the thank you page by total sessions on the landing page, and multiplying by 100.
Average session duration
Average session duration is another metric you’ll often see in Analytics — and another one to not worry about too much.
Like with bounce rate, average session duration doesn’t mean very much in isolation. Consider the emergency locksmith example again. How long a user spends on your website is irrelevant as long as they’re completing actions you want them to take.

Where average session duration differs however is in the fact that it’s not even accurate.
Because of the way Google Analytics works, it is only able to estimate session duration for sessions of users that visit more than one page. For that reason, average session duration is only ever an estimate of non-bounced users. If you have a 70% bounce rate, the session duration estimate is only for that 30% that haven’t bounced.
What’s more, session duration will never take into account the final page a user has visited. If a user goes on three web pages, Analytics will estimate the session duration based on the first two pages only.
Because of this inaccuracy, it’s not really worth losing sleep over when it comes to reporting.
Organic rankings
Finally, I want to talk about your keyword rankings.
Or should I say, searching for your own keywords and then reporting on the rankings.
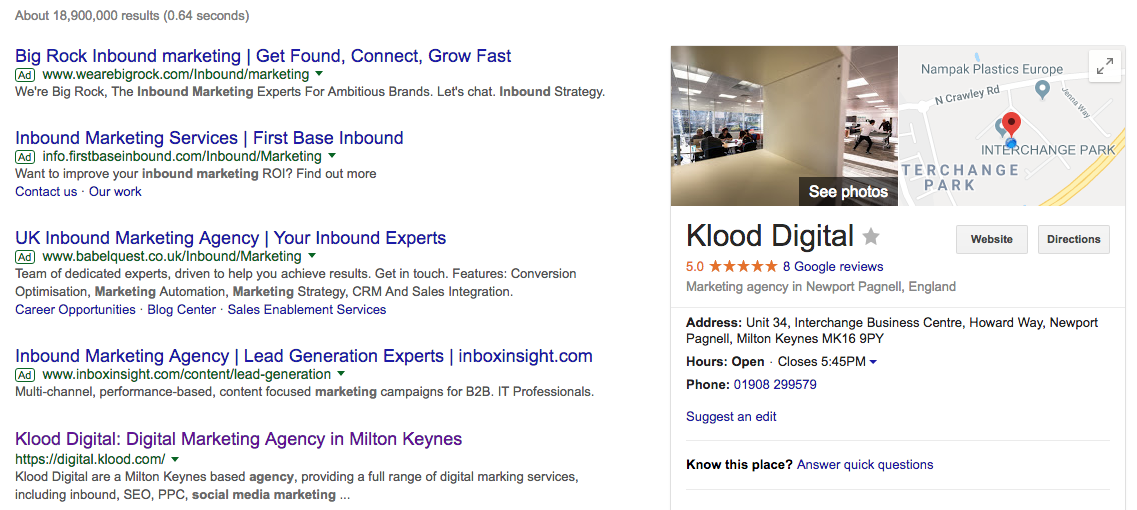
Yes, where your keywords rank is important. After all, if they don’t rank highly then you’re not going to receive organic traffic, and you’re going to have to pay for it instead.
The problem is that Google has changed the way it serves its search results in recent years — a lot.
Users see different results based on where they live, previous search behaviour and what websites they’ve visited before. This makes it very hard to report on keyword rankings accurately, especially if you’re searching for them yourself.
Using incognito mode means your search behaviour won’t influence what you see, but that won’t take location into consideration.
There are various tools you can use to monitor rankings such as Moz, as well as FATRANK which is a free Google Chrome extension, but these should only be used as an indicator rather than the absolute truth.
Monitor organic traffic levels overall, and by specific pages, to complement your reporting and get a more accurate picture of what’s happening.
Our content includes affiliate links. This means that we may receive a commission if you make a purchase through one of the links on our website. This will be at no cost to you and helps to fund the content creation work on our website.